
PE as a Predictor of 20-yr Returns (via Prof Robert Shiller)
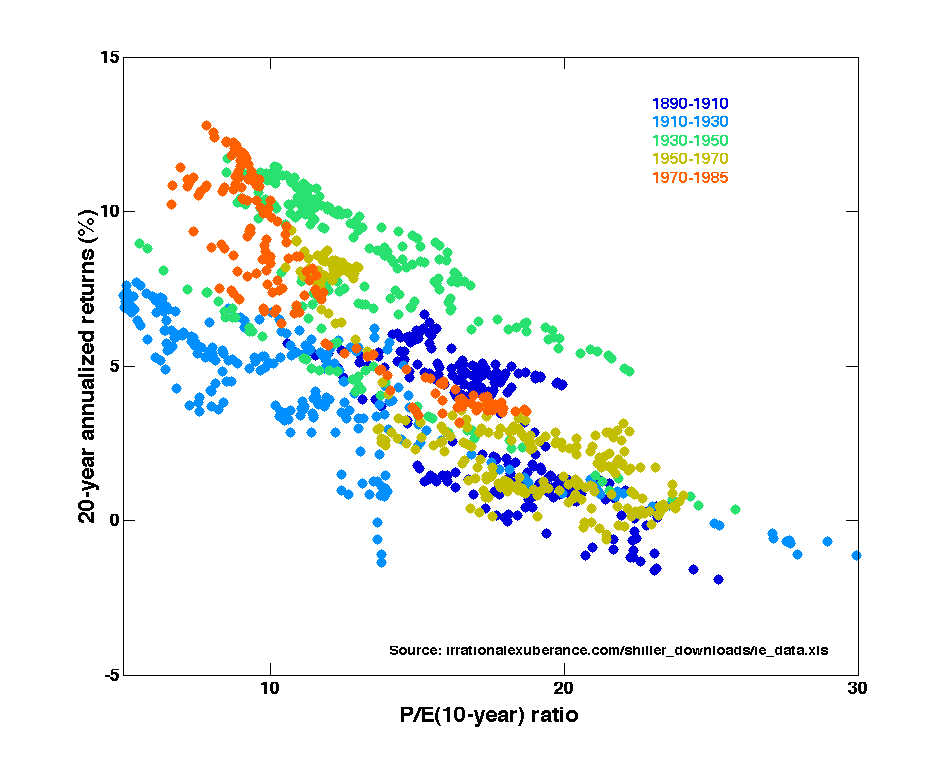
This graph presents the relationship between P/E and 20-yr annualized returns of the S&P 500 (stock market).
- P/E (Price/Earnings) - The price you pay for each dollar earned/profit
- Higher PE = more expensive
- Lower PE = less expensive
- Prof Shiller uses an adjusted PE which is the a price paid for the average annual dollars earned over the past 10 years
- 20-yr Annualized Returns - the average annual return over the next 20 years, after the purchase
 Professor Shiller has separated his data into 5 time periods (20-25 yrs per period). The graph seems to provide evidence that, purchasing stocks at a lower PE (less expensive) typically results in a higher 20-yr return, than otherwise. Just as importantly, this relationship between cheaper stocks and higher returns appears to be true for each of the 5 time periods, which covers the period from 1890-1985.
Where are stocks now? At today's S&P value of approximately 1200, the 10-yr PE Ratio is currently at 22. Looking at the graph, evidence indicates that we should perhaps expect 20-yr returns of less than 5% per year if we were to purchase stocks at current prices. Macro-level indicators such as these are important for making investment decisions because they can often help us set the right expectations about future returns. They also act as a guiding light during oscillating periods of Fear & Greed, affording us the fortitude to buy when prices are low, and the discipline to differ purchases (or sell) when valuations become frothy.
No comments:
Post a Comment